 New York Know
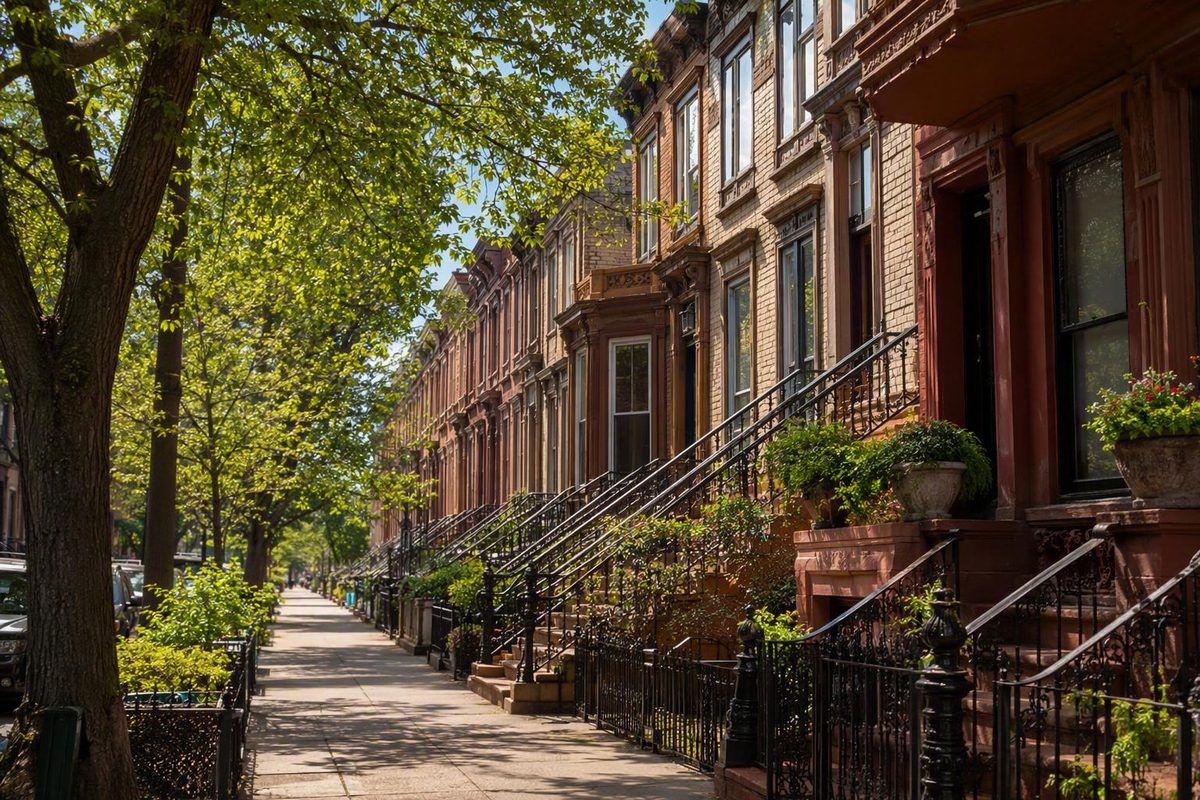
Brownsville is a predominantly residential neighborhood in eastern Brooklyn. Yet a simple description rarely explains it well. Its borders are informal, published population totals use different geographies, and its public image often obscures the forces that shaped it: immigration, discriminatory housing policy, public investment, community organizing, and continuing affordability pressure.
A useful introduction to Brownsville, Brooklyn, therefore requires more than a list of facts. It requires knowing which “Brownsville” a dataset measures, placing public housing within a broader housing landscape, and approaching the neighborhood as a lived community rather than a reputation.
Related: Which Stops Does Each NYC Subway Line Make?.
Brownsville at a glance: location, boundaries and statistical geographies
Brownsville lies in East Brooklyn. General descriptions usually place Crown Heights and related northern areas to its north or northwest, East New York to the east, Canarsie to the south, and East Flatbush to the west. Some sources also name Ocean Hill, Bedford–Stuyvesant, Cypress Hills, or New Lots when describing particular edges. These differences are not necessarily errors: New York City neighborhood borders are informal and are not fixed universally across maps, institutions, and datasets.
ZIP Codes 11212 and 11233 are associated with Brownsville, with 11212 commonly identified as its primary ZIP Code. A postal geography can include blocks that residents or other maps identify differently.
The most important distinction is between Brownsville proper and Brooklyn Community District 16. The city describes Community District 16 as bounded by Broadway to the north, Linden Boulevard to the south, Van Sinderen Avenue to the east, and a multipart western edge involving East 98th Street, East New York Avenue, Ralph Avenue, and Atlantic Avenue. Those boundaries belong to the district, not automatically to Brownsville proper, as the Brooklyn Community Board 16 profile makes clear.
Methodology: four geographies that should not be mixed
- Neighborhood: An informal cultural and geographic area whose boundaries can vary by map or researcher.
- Community district: A formal local planning and advisory geography. Community District 16 includes Ocean Hill and Brownsville.
- ZIP Code: A postal-delivery area, not a neighborhood boundary.
- Police precinct: An operational NYPD geography. The 73rd Precinct is associated with Brownsville, but it should not be assumed to match the neighborhood exactly.
Before interpreting any statistic, check its year, geographic unit, and methodology. A figure for Community District 16, ZIP Code 11212, or the 73rd Precinct is not necessarily a Brownsville-only figure.
This distinction matters for practical planning too. A station, park, or institution described as being “in the Brownsville area” may lie near a disputed edge. For visitors, a street address is more useful than a generic neighborhood pin.
How many people live in Brownsville? Reading the numbers correctly
The best-supported recent neighborhood estimate in the supplied evidence is 111,286 residents in 2024, using the NYU Furman Center’s Brownsville geography. It is an estimate, not a new decennial census count.
The evidence also contains sharply different figures. The Furman Center’s own profile reports 115,433 residents in 2010 and 128,369 in 2019 within its Brownsville series. Separately, Wikipedia and Apple Maps publish a 2010 census-based figure of 58,300. Brooklyn Community Board 16 reports 101,000 residents in 2023 for the broader Ocean Hill–Brownsville district. The source pack does not resolve why the two published 2010 values differ, and the district figure does not measure Brownsville alone.
| Year | Published population | Source geography or description | How to read it |
|---|---|---|---|
| 2010 | 58,300 | Published as a Brownsville census-based count | A separate neighborhood definition that conflicts with Furman’s 2010 figure |
| 2010 | 115,433 | Furman Center Brownsville geography | Part of Furman’s neighborhood data series |
| 2019 | 128,369 | Furman Center Brownsville geography | A survey-derived estimate, not a decennial count |
| 2023 | 101,000 | Community District 16/Ocean Hill–Brownsville | Applies to the broader administrative district, not Brownsville alone |
| 2024 | 111,286 | Furman Center Brownsville geography | The strongest recent Brownsville-specific estimate in the evidence |
The 2010, 2019, 2023, and 2024 values should not be arranged into a simple growth narrative. They differ by year, source geography, or both. Even figures shown in one profile may be survey estimates rather than direct counts. The NYU Furman Center’s Brownsville profile reports the 2010, 2019, and 2024 values and explains that many recent indicators are derived from Census or American Community Survey data. The 101,000 figure belongs specifically to Community District 16 in 2023, according to Brooklyn Community Board 16.
Apparent differences can therefore reflect sampling and geographic definitions as well as actual population change.
The practical answer is qualified: Brownsville had an estimated 111,286 residents in 2024 in the Furman Center’s neighborhood geography. Anyone using another total should identify the year, source, and area it describes.
From nineteenth-century settlement to Little Jerusalem and demographic change
Brownsville’s modern development is generally traced to 1858, when William Suydam subdivided land into lots. Charles S. Brown later acquired and subdivided property, and the neighborhood took his name. From the late nineteenth century into the first half of the twentieth, Brownsville became a major working-class Jewish immigrant neighborhood.
Housing was central to this development. Jewish families, many arriving from crowded Lower East Side tenements, found housing in Brooklyn, although Habitat NYC’s account says conditions in Brownsville could also be overcrowded and substandard.
By 1920, more than 80,000 of roughly 100,000 Brownsville residents were reported to be Russian Jews, and the neighborhood acquired the nickname “Little Jerusalem.” These figures and the account of Suydam’s and Brown’s roles appear in a tertiary historical overview of Brownsville, so they are best read as a broad chronology rather than independently verified archival findings.
Habitat NYC places the beginning of Brownsville’s demographic transition in the 1930s, in connection with the Great Migration and later Caribbean and Latin American migration. Other summaries emphasize the much more visible transformation around the 1950s, when large numbers of Jewish residents had left and Brownsville became increasingly Black and Latino. These accounts describe different stages of a longer process rather than necessarily contradicting one another.
This history should not be reduced to a neutral story in which one population simply “replaced” another. The evidence supports treating migration and housing policy as connected, while avoiding claims that demographic change itself caused Brownsville’s later difficulties.
Brownsville’s subsequent identity grew through the arrival and community-building of African Americans from the South, Caribbean immigrants, Puerto Rican New Yorkers, and other Latin American migrants and immigrants. These communities developed institutions, organizing traditions, and forms of historical preservation while living within a built environment shaped by earlier overcrowding and later public policy.
The central correction is that Brownsville was not always demographically the same, and its twentieth-century challenges cannot be explained by demographic transition alone.
Housing policy and the neighborhood Brownsville became
Few aspects of Brownsville are as visible—or as frequently oversimplified—as housing. Large public-housing developments are prominent, but they are only one part of a landscape that also includes private rentals, income-restricted apartment buildings, nonprofit developments, one- and two-family homes, and a relatively small owner-occupied sector.
In its neighborhood history, Habitat NYC and Westchester interprets Brownsville’s twentieth-century disinvestment as partly the result of redlining, discriminatory banking and housing policies, and other racist practices. That framing connects physical decline to decisions affecting credit, property, public services, and household mobility rather than to an inherent neighborhood defect. Because Habitat is also describing communities in which it works, its interpretation and project totals should remain attributed to the organization.
Public and subsidized housing nevertheless have an unusually important local role. In 2025, the Furman Center reported 656 subsidized properties, including 49 public-housing properties containing 8,613 units. Public housing represented 21.3% of rental units that year. These figures are more defensible than the recurring but insufficiently verified claim that Brownsville has the highest concentration of public housing in the United States. (NYU Furman Center)
The numbers prevent two opposite mistakes. Public housing is not marginal: more than one-fifth of rental units is a substantial share. Yet most rental units are not public housing, so the neighborhood cannot be reduced to towers and superblocks.
Affordable ownership has provided another approach. East Brooklyn Congregations’ Nehemiah program used newly built homes to expand ownership opportunities, while Habitat developed or rehabilitated homes and condominiums. Habitat reports more than 100 of its homes in Brownsville and highlights projects including Atlantic Avenue, SEED, and Dean Street Condominiums. Those figures describe Habitat’s own work and are not presented as an independent audit.
The tradeoff is structural. The supplied evidence does not establish that either approach alone resolves low incomes, maintenance problems, limited vacancies, or the gap between eligibility formulas and neighborhood earnings.
Brownsville’s built environment is therefore best understood as the accumulated result of several systems: exclusion from conventional finance, large-scale public construction, private rental ownership, nonprofit intervention, and community campaigns for ownership. These systems coexist rather than forming one uniform housing market.
Brownsville today: demographics, income and housing pressure
The Furman Center’s 2024 profile offers the most consistent recent snapshot within its Brownsville geography. It estimated that residents were 67.6% Black, 20.9% Hispanic, 4.6% White, and 2.7% Asian. These are survey-derived categories as presented by the source; the excerpt is not a complete account of identity or ancestry.
| 2024 indicator | Brownsville | New York City | What it suggests |
|---|---|---|---|
| Median household income | $45,980 | $83,970 | Brownsville’s median was substantially lower |
| Poverty rate | 29.3% | 18.0% | Poverty was more prevalent locally |
| Poverty rate, residents under 18 | 37.3% | — | Children faced especially high measured poverty |
| Homeownership rate | 15.8% | 32.7% | Ownership was less than half the citywide rate |
| Median gross rent | $1,350 | — | Reported rent plus applicable utility costs |
| Rental vacancy rate | 1.4% | — | Few rental units were estimated to be vacant |
| Severely rent-burdened renter households | 29.7% | — | Nearly three in ten spent more than half their income on rent |
All figures in this table are from the Furman Center’s 2024 Brownsville profile and, where shown, its citywide comparison data.
Severe rent burden means spending more than half of household income on rent. It is an income-to-cost measure, not simply a statement that nominal rent is high. A $1,350 median gross rent may be lower than rents in many parts of New York, but it can still impose severe pressure where household income is also much lower. In 2024, the Furman Center estimated that 29.7% of Brownsville renter households met that threshold.
The 1.4% rental vacancy estimate indicates a tight rental market within the source’s methodology. It does not, by itself, prove any particular household outcome, but it does show that relatively little rental inventory was estimated to be vacant in 2024.
Housing quality is another dimension. Serious housing-code violations increased from 169.3 per 1,000 privately owned rental units in 2024 to 184.5 in 2025, according to the Furman Center. This measure concerns privately owned rentals rather than NYCHA units and should not be generalized to every building.
Low homeownership adds another layer. Brownsville’s 15.8% homeownership rate was less than half the 32.7% citywide rate in 2024. That comparison establishes a relatively small owner-occupied sector, although the supplied evidence does not prove how changes in property values affect individual owners or renters.
Commercial listing sites are not a sound substitute for these measures. The two measures answer different questions.
Taken together, the 2024 indicators describe a neighborhood where housing can be comparatively inexpensive by New York standards yet still deeply unaffordable relative to local income. That is the essential distinction between lower price and affordability.
New housing, rising prices and the affordability question
Brownsville has seen substantial multifamily construction. From 2010 through 2025, the Furman Center reported 5,559 units built in buildings containing at least four units. Of these, 4,142 were classified as income restricted and 1,401 as market rate. The component figures do not account for every unit in the total, so they should be reproduced as reported rather than forced into an exhaustive breakdown.
The Furman Center describes its income-restricted count as conservative because sufficiently granular information is unavailable for every project. “Income restricted” also does not mean affordable to every Brownsville household. The source identifies the classification, but the evidence does not establish whether all such units are affordable to households near Brownsville’s median income.
In 2025, the Furman Center reported that new-building permits covered 647 residential units, while new certificates of occupancy covered 793 units. Because the evidence pack does not include an official Department of Buildings definition of those stages, the safest conclusion is limited: these are distinct measures that may concern different projects and should not be subtracted from one another or treated as a completion rate.
Residential property prices had risen a reported 113% since 2009 by the Furman profile’s reporting period. That increase sits beside a 29.3% poverty rate, 15.8% homeownership rate, 1.4% rental vacancy rate, and severe rent burden affecting 29.7% of renters. These figures document appreciation and continuing household pressure, but they do not independently prove displacement, gentrification, or broad prosperity.
The central affordability question remains unresolved. The evidence establishes that Brownsville added housing, much of it classified as income restricted, while residents continued to face low incomes, scarce vacancies, and substantial rent burdens. It does not show whether construction reduced displacement risk, enabled existing residents to remain, or produced homes affordable to households near the neighborhood median.
A proposal at 69 Chester Street shows why development language must remain precise. On August 24, 2026, New York YIMBY reported that applications had been filed for a proposed nine-story mixed-use building with 99 residences, commercial space, and community-facility space near the L train’s Sutter Avenue station. The 69 Chester Street filing report gave no completion date and did not identify an affordable-housing component.
A reported filing is not evidence that a project has been approved, financed, built, completed, or occupied. Nor does it establish eventual rents. Responsible tracking requires checking each project stage separately rather than treating an application as a finished contribution to housing supply.
More construction can increase the number of units, but unit count alone cannot answer who benefits. For Brownsville, the crucial questions include the incomes new apartments serve, whether local households can qualify, the condition of existing homes, and whether residents can remain connected to their community.
Corridors, community memory and places that explain Brownsville
For a newcomer, Brownsville becomes more legible through selected corridors and institutions rather than through an attempt to “see the whole neighborhood.” Pitkin Avenue is the clearest starting point. BlackPast and a 2021 street-level walking video both identify it as a principal commercial corridor, although that historical and observational evidence does not establish the current occupancy or financial health of every storefront.
BlackPast reports that Pitkin Avenue underwent Business Improvement District-linked redevelopment in 2013 and that the historic Loew’s Pitkin Theatre—opened in 1929—was later restored to its earlier appearance. These claims illustrate reported reinvestment in a corridor with longstanding commercial importance, but they come from a nonprofit historical summary rather than primary municipal records. (BlackPast)
Community memory is equally important. Habitat describes Rosetta “Mother” Gaston as a historian, educator, community activist, and civil-rights leader whose work preserved and taught African American history locally.
Brownsville Heritage House continues that emphasis on neighborhood history. Habitat places it within the Stone Avenue branch of Brooklyn Public Library. The evidence does not adequately verify the often-repeated superlative that the building was the world’s first children-only library, so the supportable point is narrower: Heritage House provides an institutional home for local historical memory.
African Burial Square adds an earlier layer. Habitat links the site to a burial ground identified on a nineteenth-century map and says officials and community organizations identified it in 2010, followed by historical-landmark designation in 2013. These details should be read as Habitat’s account because the supplied evidence does not include a Landmarks Preservation Commission record.
Rockaway Avenue and Belmont Avenue are additional corridors visible in a street-level walk recorded in July 2021. Such footage can help viewers understand block scale, street layout, and transitions between housing and commercial areas. It cannot verify that businesses, maintenance conditions, or street activity remain the same today.
These places offer three complementary ways to read Brownsville:
- Pitkin Avenue reveals commercial history and reported reinvestment.
- Heritage House and Stone Avenue Library foreground community-authored memory.
- African Burial Square connects the neighborhood to an earlier history of land, burial, and recognition.
A visitor who approaches these places with a purpose will learn more than one who arrives to test a stereotype.
Planning a visit responsibly: access, expectations and evidence limits
Brownsville is not one generic destination. Its points of interest are spread across a residential landscape, and stations associated with the area serve different corridors and edges. Before planning a route, choose a specific institution, address, corridor, or station.
Secondary neighborhood sources associate different parts of the area with the 2, 3, 4, 5, and L services and name stations including Rockaway Avenue, Saratoga Avenue, Junius Street, Sutter Avenue–Rutland Road, and Livonia Avenue. Because the evidence pack contains no current official MTA source confirming those details, treat the list as general orientation rather than live service guidance. Check the MTA’s current map, service notices, and trip planner before traveling.
Generic trip planners can be misleading when the origin and destination are imprecise. A claim of a direct 27-minute subway trip from “New York” to “Brownsville,” for example, is not useful when the stated journey begins at a particular Manhattan station and ends at Crown Heights–Utica Avenue. Travel time depends on the actual origin, destination, transfer needs, and current service.
A compact visit might combine a defined stretch of Pitkin Avenue with a visit to Brownsville Heritage House or another institution—but only after confirming public access and current opening hours directly. Rockaway Avenue or Belmont Avenue may help orient a route, but a video recorded in 2021 cannot establish present businesses or street conditions.
Safety requires the same discipline about geography and time. The supplied evidence does not include current, geographically aligned NYPD statistics that would justify labeling Brownsville categorically safe, dangerous, or New York’s “most dangerous” neighborhood.
A daytime walking video records what one person encountered on one route at one time. Older resident reviews reflect individual perceptions. Neither establishes neighborhood-wide conditions across different blocks, hours, or dates.
Use ordinary city awareness without turning it into a verdict on the community:
- Confirm the exact destination and current opening hours.
- Check current subway and bus service with the MTA.
- Prefer a clear route over improvised wandering.
- Maintain normal awareness of surroundings and personal belongings.
- Adjust the plan if current conditions differ from an older guide.
This destination-first approach fits New York Know’s area-based trip-planning method: group nearby stops, build a day that makes sense on foot, and avoid unnecessary cross-city movement. Its walking-first itinerary model likewise emphasizes a clear starting point and a route that flows rather than zigzags. Applied to Brownsville, that means depth over coverage—a specific corridor and verified institution, not an attempt to survey an entire neighborhood as spectacle.
Frequently asked questions
Where is Brownsville in Brooklyn?
Brownsville is a predominantly residential neighborhood in eastern Brooklyn. It is generally described as lying east of East Flatbush, north of Canarsie, west of East New York, and south or southeast of Crown Heights and related northern areas. Exact descriptions vary because neighborhood borders are informal.
Do not confuse Brownsville alone with Community District 16, commonly called Ocean Hill–Brownsville, which covers a broader administrative area. ZIP Codes 11212 and 11233 are associated with Brownsville, with 11212 commonly described as the primary ZIP Code.
What is the population of Brownsville, Brooklyn?
The strongest recent estimate in the evidence is 111,286 residents in 2024 for the Furman Center’s Brownsville geography. It is an estimate rather than a direct census count.
Other figures require context. Furman reports 115,433 for 2010 and 128,369 for 2019 within its series, while Wikipedia and Apple Maps publish a separate 2010 census-based figure of 58,300. Community District 16 reported 101,000 residents in 2023, but that figure applies to the broader Ocean Hill–Brownsville district. These values should not be treated as one continuous population-growth series.
Which subway lines and stations are associated with Brownsville?
Secondary neighborhood sources associate different parts of Brownsville with the 2, 3, 4, 5, and L trains. Frequently named stations include Rockaway Avenue, Saratoga Avenue, Junius Street, Sutter Avenue–Rutland Road, and Livonia Avenue.
The supplied evidence does not include current official MTA verification, so this list should be treated only as general orientation. Service is not uniform across the neighborhood, and the best station depends on the exact destination. Check current MTA maps and service notices before traveling.
Is Brownsville safe to visit?
The evidence used for this guide does not contain current, geographically aligned NYPD data sufficient to classify Brownsville categorically as safe or unsafe. Historic reputation, older resident comments, and one daytime walking video cannot establish present conditions across the neighborhood.
Plan around a specific destination, verify the route and operating hours, check current transit, and use ordinary situational awareness. A precise, purpose-led visit is more useful than either dismissing documented concerns or treating the neighborhood as a danger-themed attraction.
What is Brownsville known for historically?
Brownsville is known for its development from nineteenth-century subdivision into a dense Jewish working-class immigrant community nicknamed Little Jerusalem, followed by a twentieth-century demographic transformation that produced a predominantly Black and Latino neighborhood.
It is also known for extensive public and subsidized housing, the effects attributed to discriminatory housing and banking policy, affordable-homeownership organizing, Pitkin Avenue, Mother Gaston’s historical work, Brownsville Heritage House, and African Burial Square. These histories belong together.
Brownsville is neither a statistic nor a reputation. It is an East Brooklyn neighborhood shaped by migration, unequal housing access, public investment, disinvestment, organizing, and current affordability pressures. Understanding it begins with using the correct geography, reading housing data without false certainty, and recognizing the corridors and institutions through which residents have preserved community memory. A responsible visit begins the same way: with a specific destination, current transit and operating information, and an interest in the neighborhood as it is—not as a headline imagines it.